¶ TEAMS Adoption & Monitor - EN
This interface is dedicated to your Microsoft Teams usage. From the distribution of classic Teams calls to Teams, via the use of your meeting rooms, you will find various relevant indicators as well as a large number of trends giving you an overall idea of the evolution of your various Teams uses.
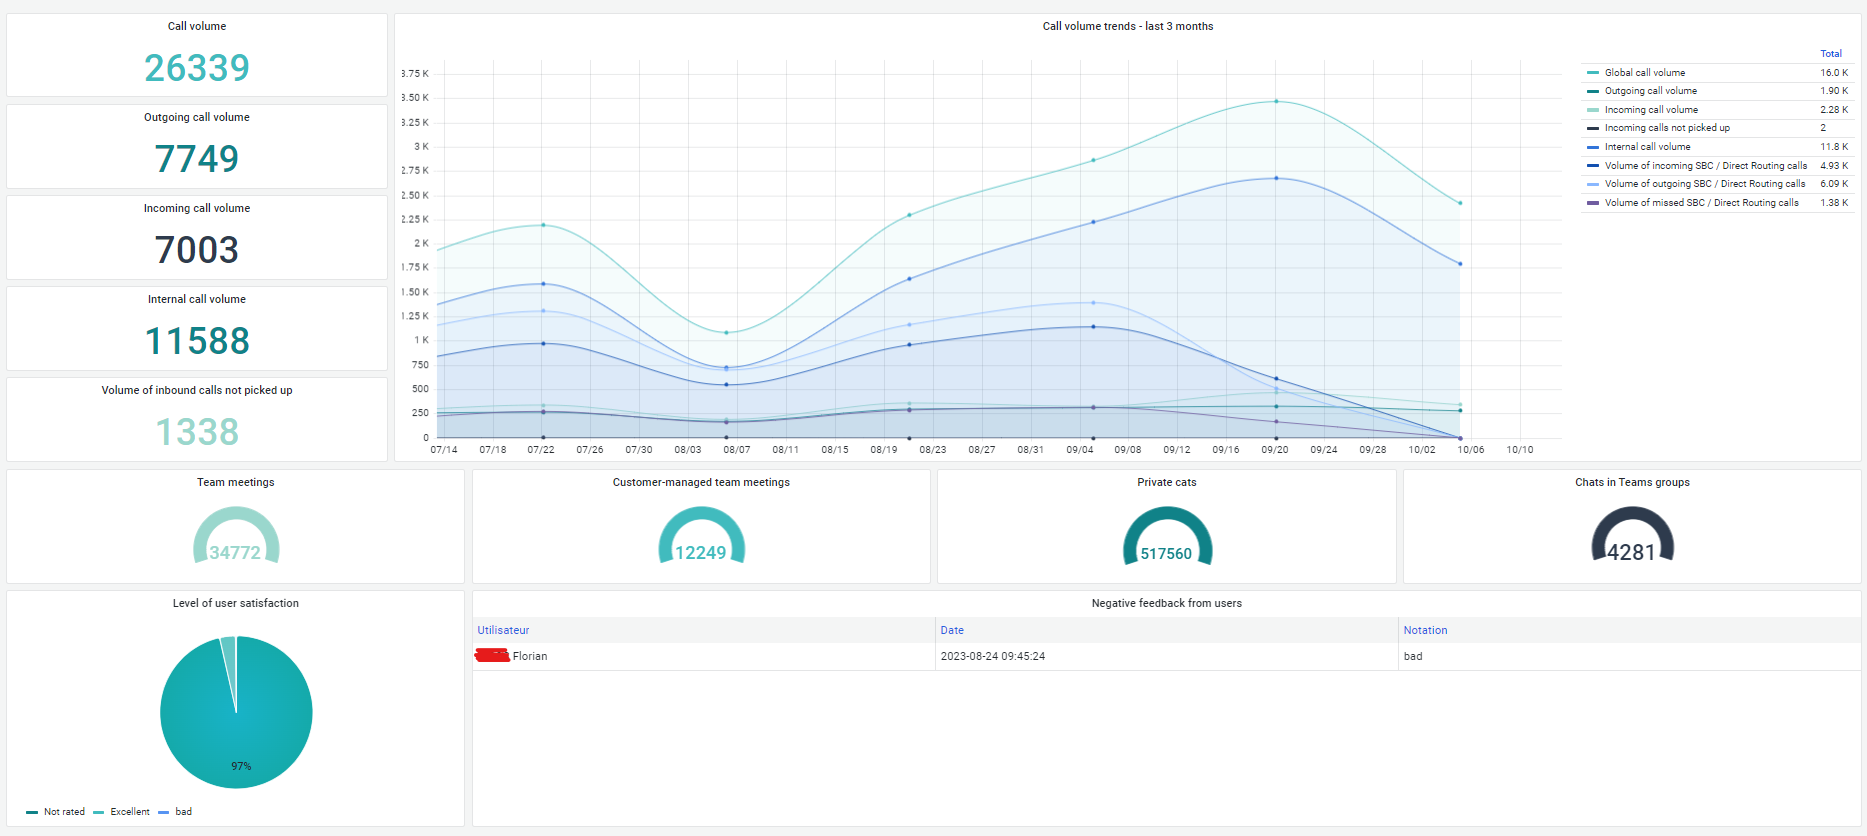
¶ TEAMS section - Global view
At a glance, you'll see the breakdown by type of Teams to Teams and SBC Direct Routing call, as well as call volume trends over the last three months.
The other indicators in this section are the distribution and volume of chats and meetings, as well as the level of satisfaction of your users, with details of any poor rating of a call.
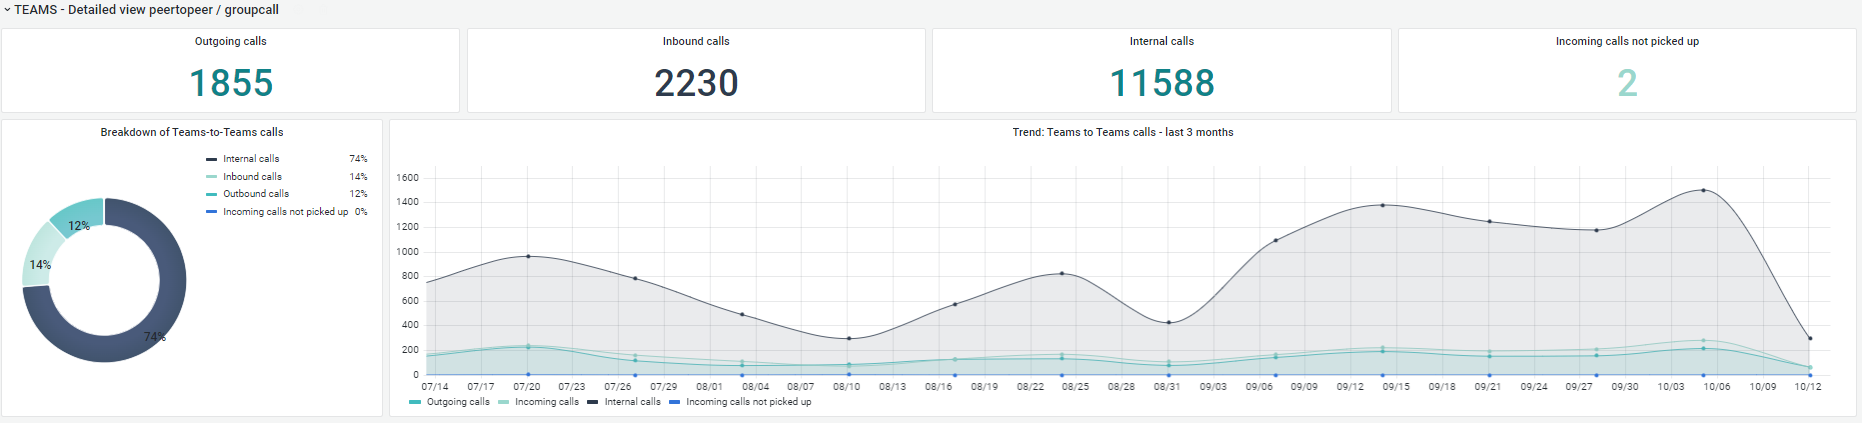
¶ TEAMS section - Detailed view peertopeer / groupcall
These indicators give you a detailed view of the breakdown of your classic Teams-to-Teams calls by type of call (incoming, outgoing, internal, incoming unanswered).
A doughnut-shaped graph shows the percentage breakdown of your Teams-to-Teams communications and the trend over the last three months.
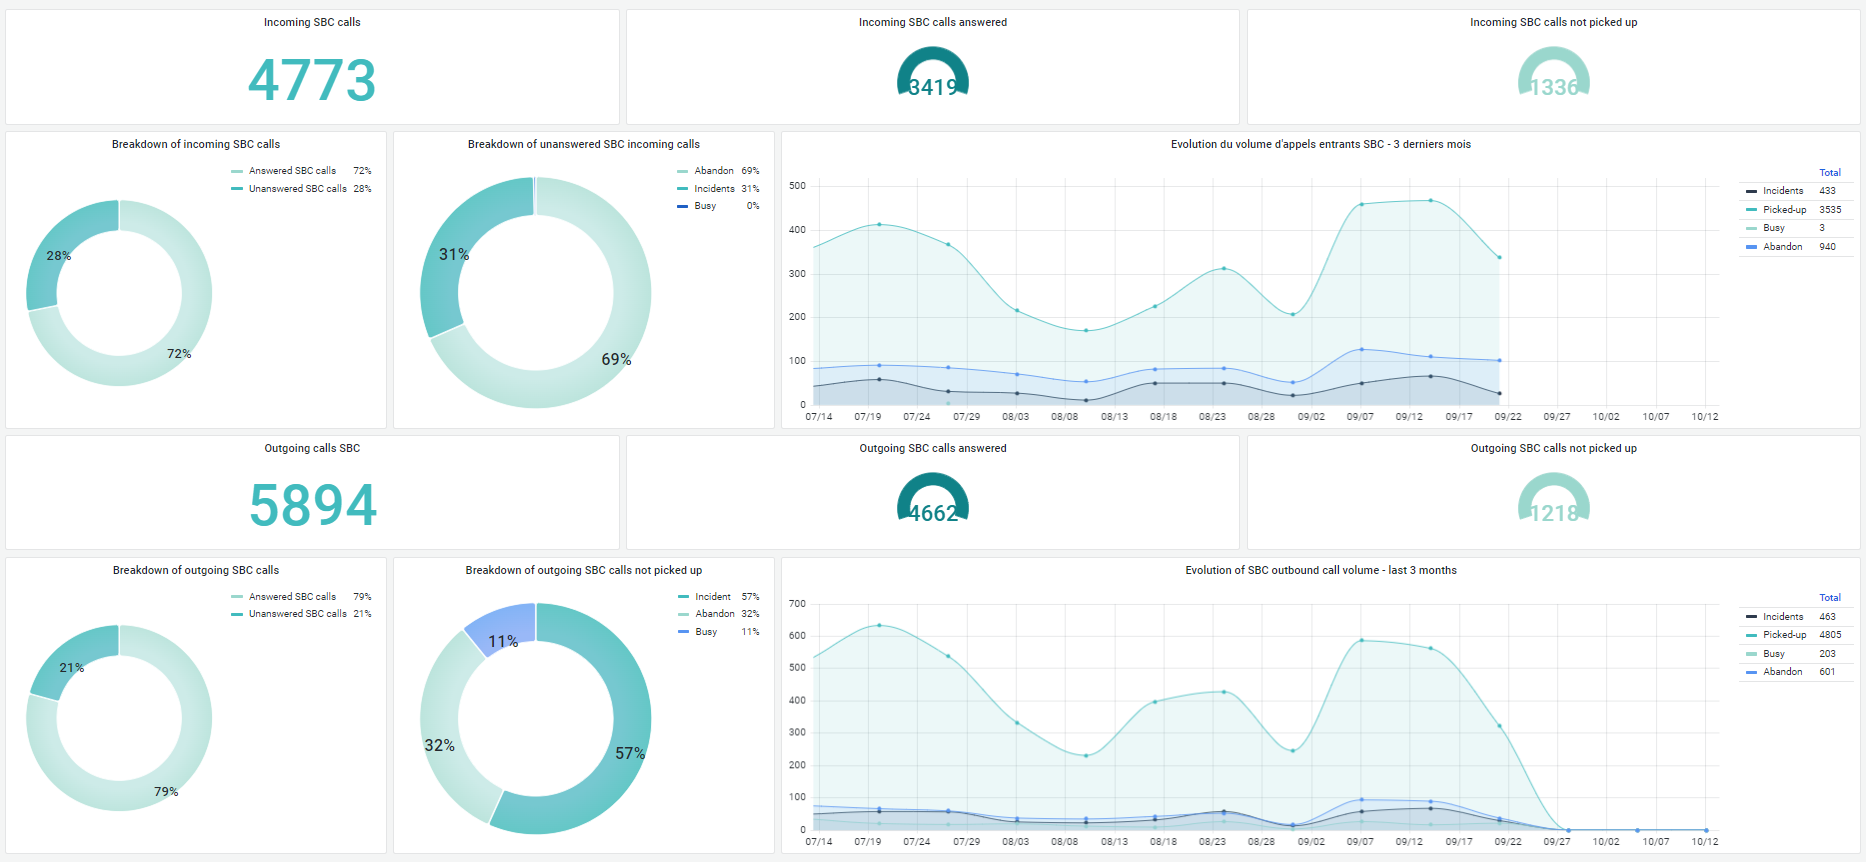
¶ TEAMS section - Detailed view of SBC/ Direct Routing
Identifying the breakdown of your SBC communications is a key point in understanding your Teams usage.
In this section, you will find the notion of SBC calls not picked up, broken down according to the main use cases, such as abandoned calls, busy calls and calls that have had an incident.
You will also find a graph showing changes over the last three months.
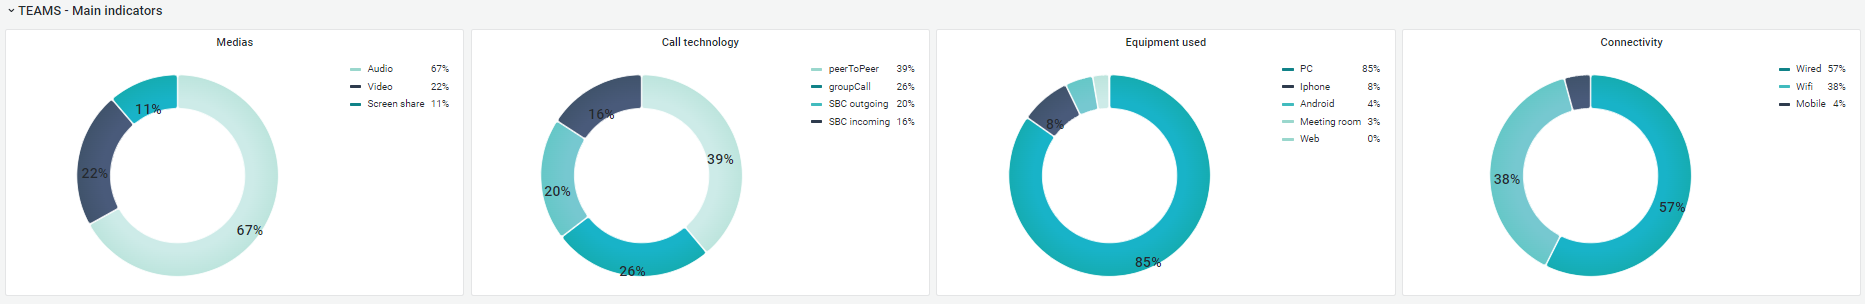
¶ TEAMS section - Main indicators
The main indicators represent the percentage breakdown of your Teams communications (classic or SBC) according to the use of your media (audio, video, screen sharing), your equipment (PC, mobile phone) or your types of calls (wired or via wifi).
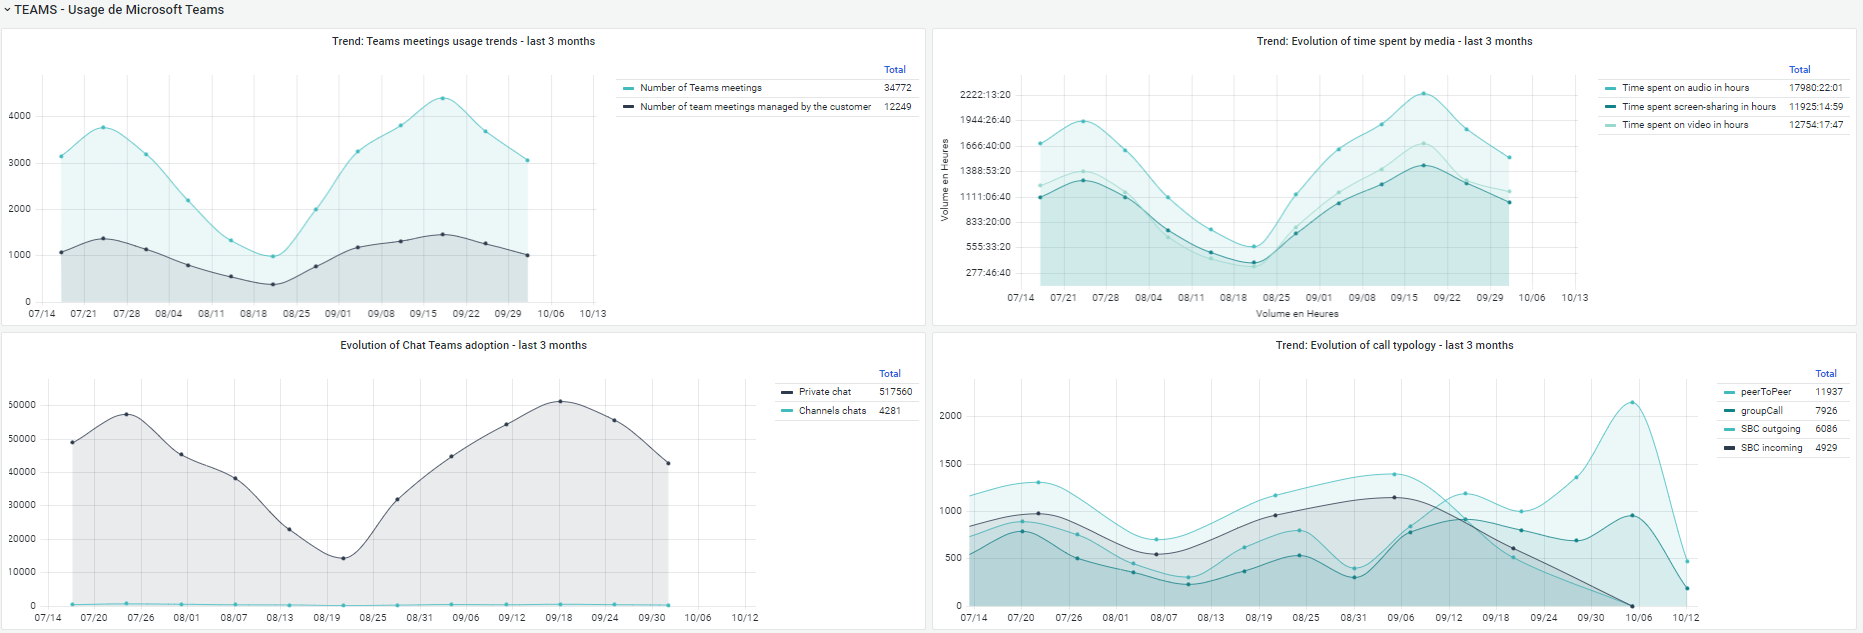
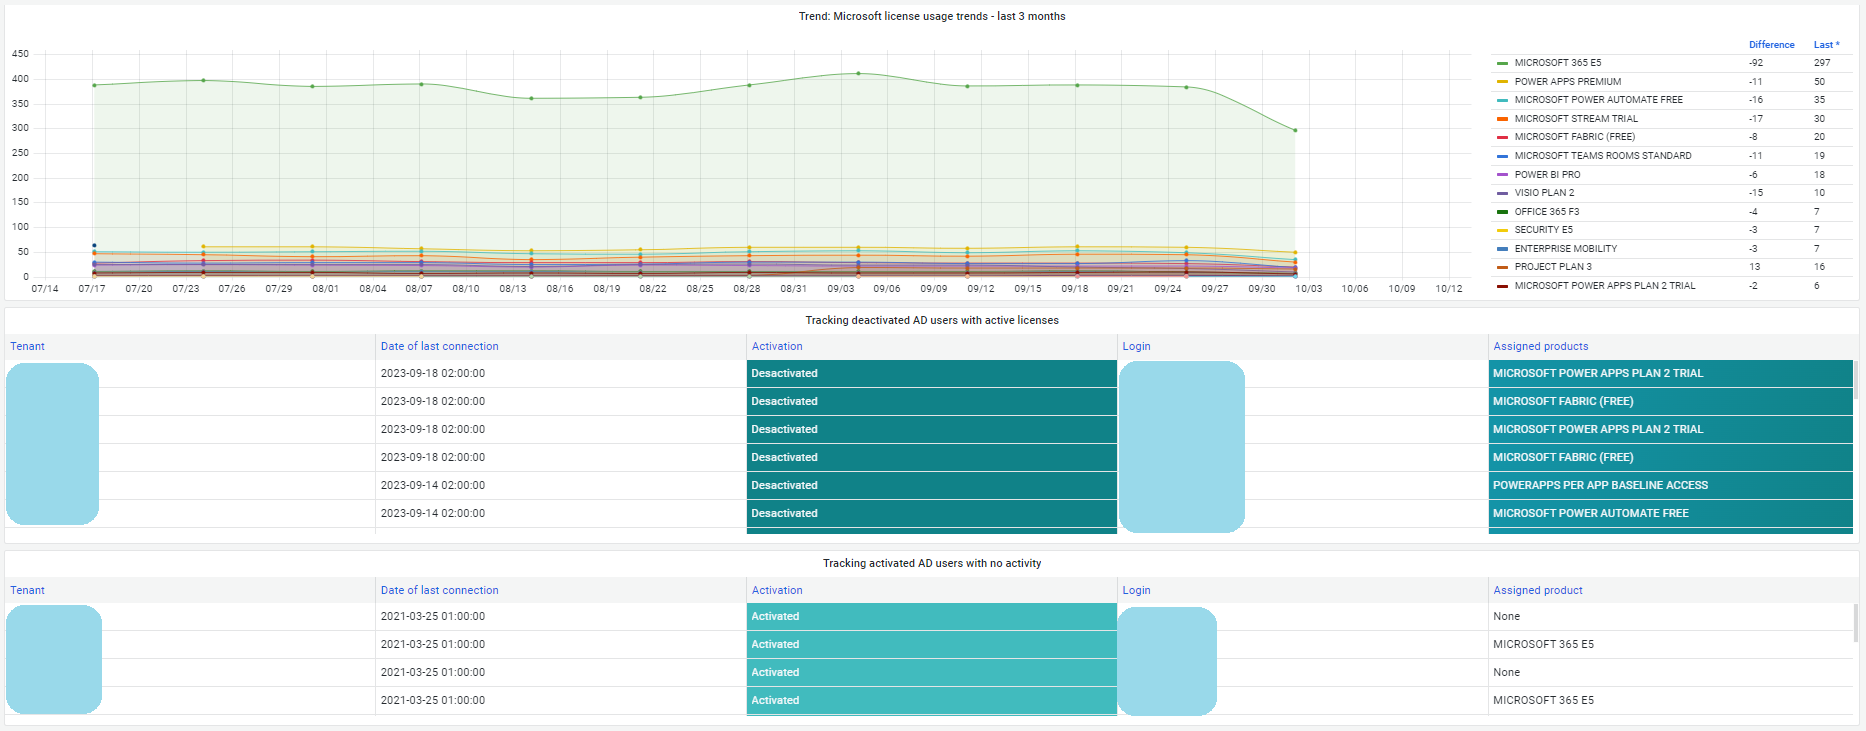
¶ TEAMS section - Microsoft Teams usage
In addition to providing you with trends on the use of your Teams (adoption of chat, evolution of time spent by media, number of meetings and type of call) over the last three months. You'll find a clear breakdown of your Teams licence consumption, as well as two tables dedicated to tracking your AD users who are either activated but not using Teams, or your AD users who are deactivated but with an assigned product (Microsoft licence).
This section also provides you with a clear view of the usage and distribution of your Teams channels.
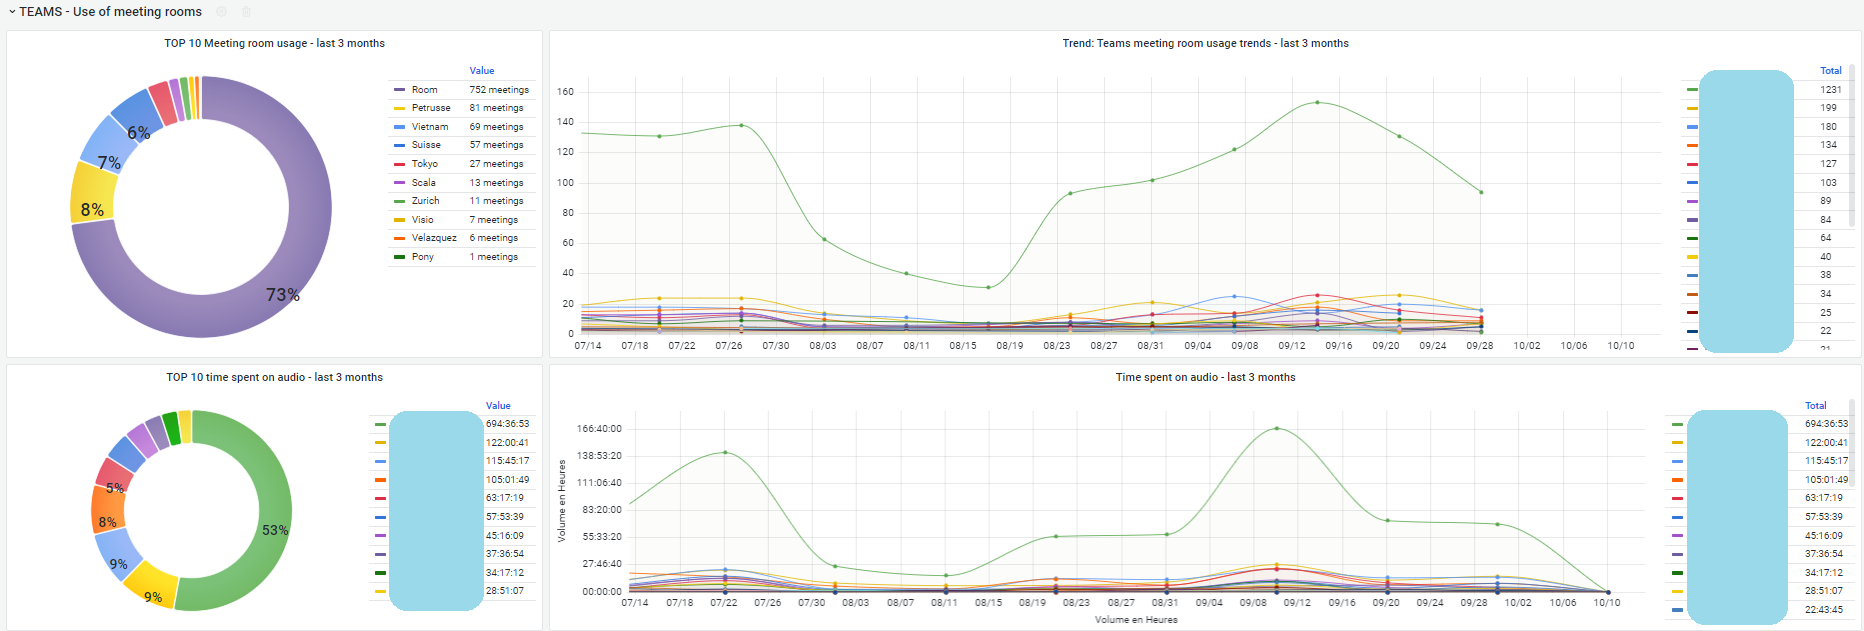
¶ TEAMS section - Use of meeting rooms
In this section, we'll look at five main areas to highlight the usage of your Teams meeting rooms.
The first axis is the breakdown of the number of meetings per room, followed by the breakdown of time spent on audio, video and screen sharing. The idea is to highlight the rooms that are used the most and to give you an overview of usage over the last three months.
Finally, you will find the Top 10 least-used rooms and a list of these rooms.
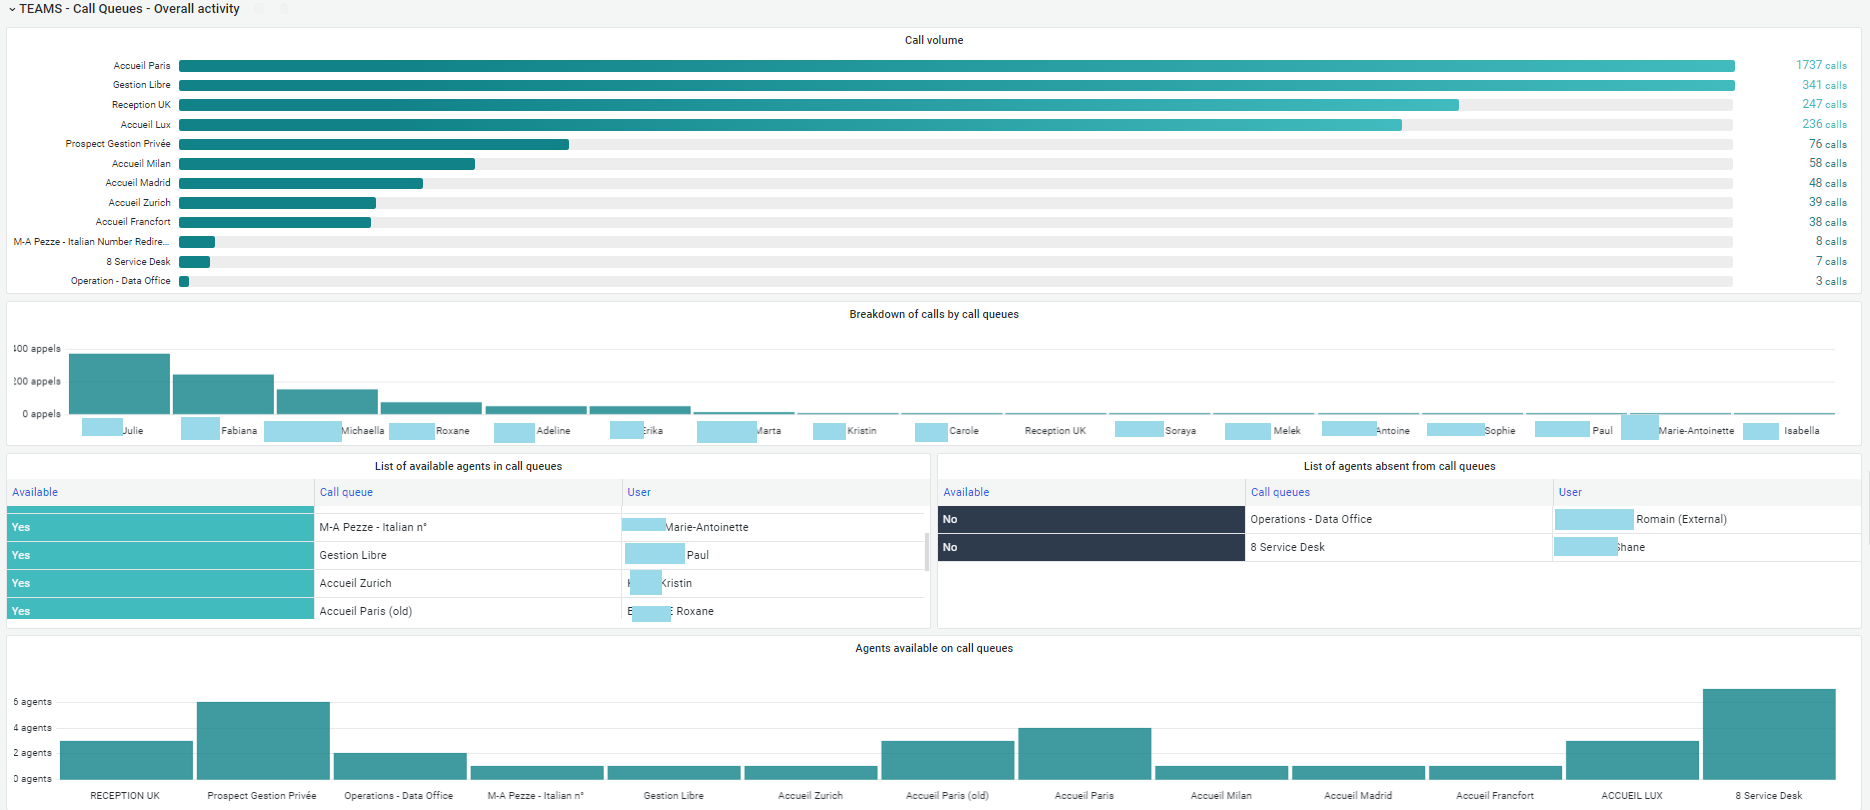
¶ TEAMS section - Queues - Global activity
Managing your queues, just like managing your meeting rooms, is a key element in understanding your Teams usage.
In just a few panels, you can see the distribution of your queues by reception and by agents (switchboard operators). You also have access to the list of agents configured on your queues and those who are absent.
Curves over the last three months show the volume of calls in queues, the time spent on audio, the volume of calls not picked up and the average waiting time in queues
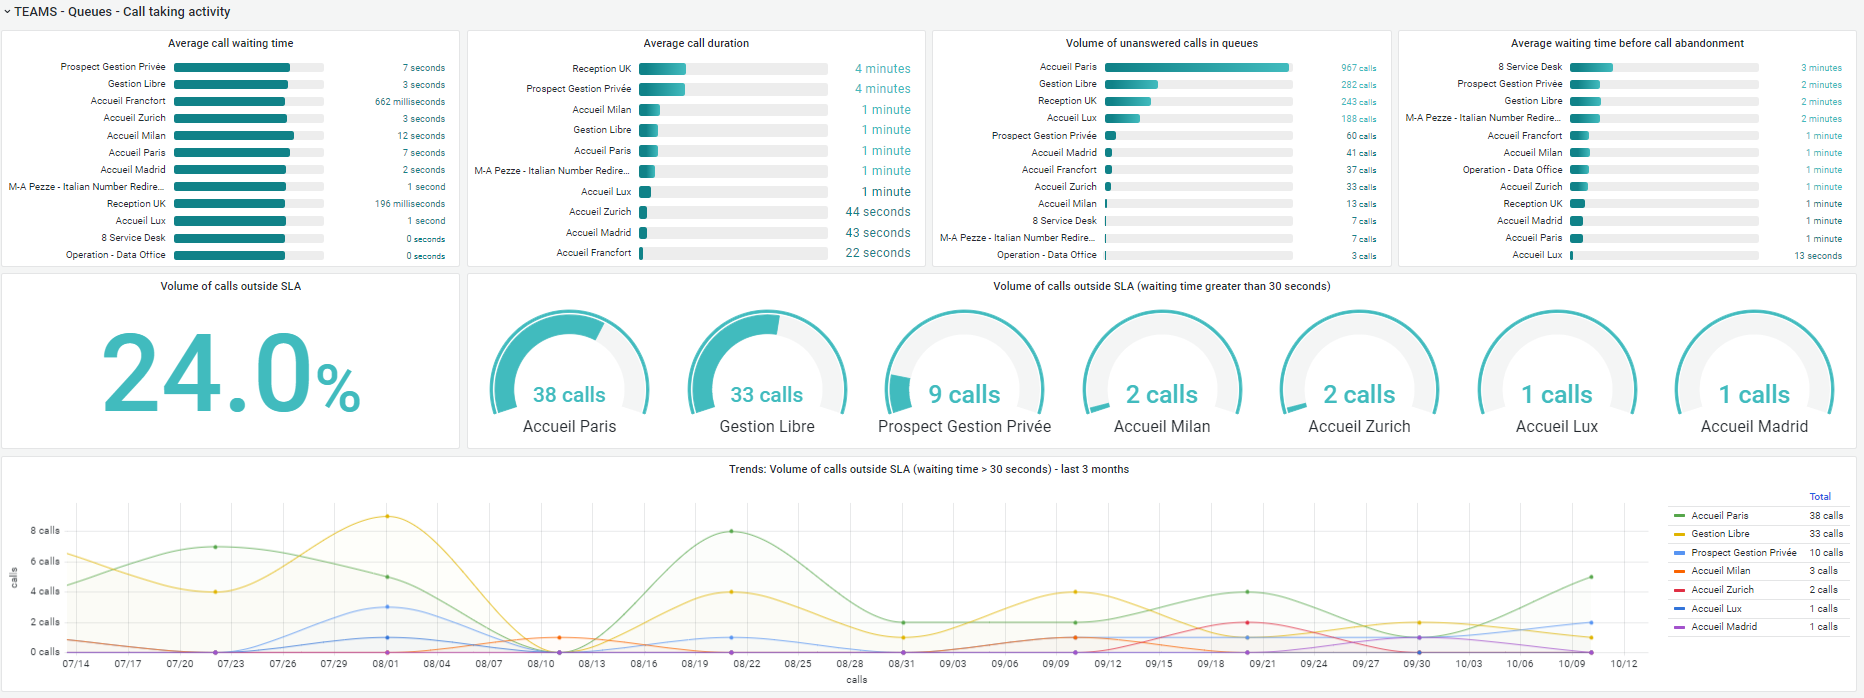
¶ TEAMS section - Queues - Call activity
View the call-taking activity of your queues in a few key indicators such as the average waiting time and the average duration of calls, the number of calls in the queue that have not been picked up and the average waiting time before a call is abandoned.
The indicators below provide an overview of the quality of your agents' reception (average waiting time, average call duration, volume of missed calls and average waiting time before abandonment). In addition, we can set up a service level agreement (SLA) to measure calls exceeding the set waiting time, for example calls with a waiting time of more than 30 seconds.
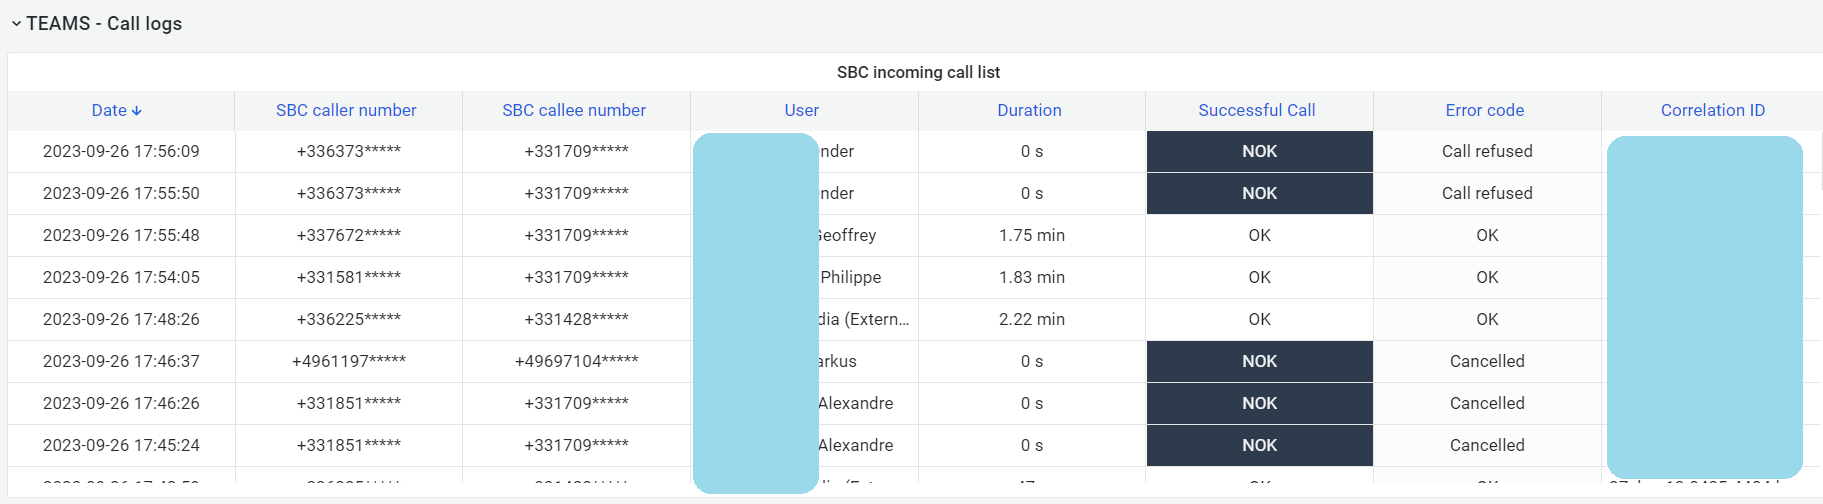
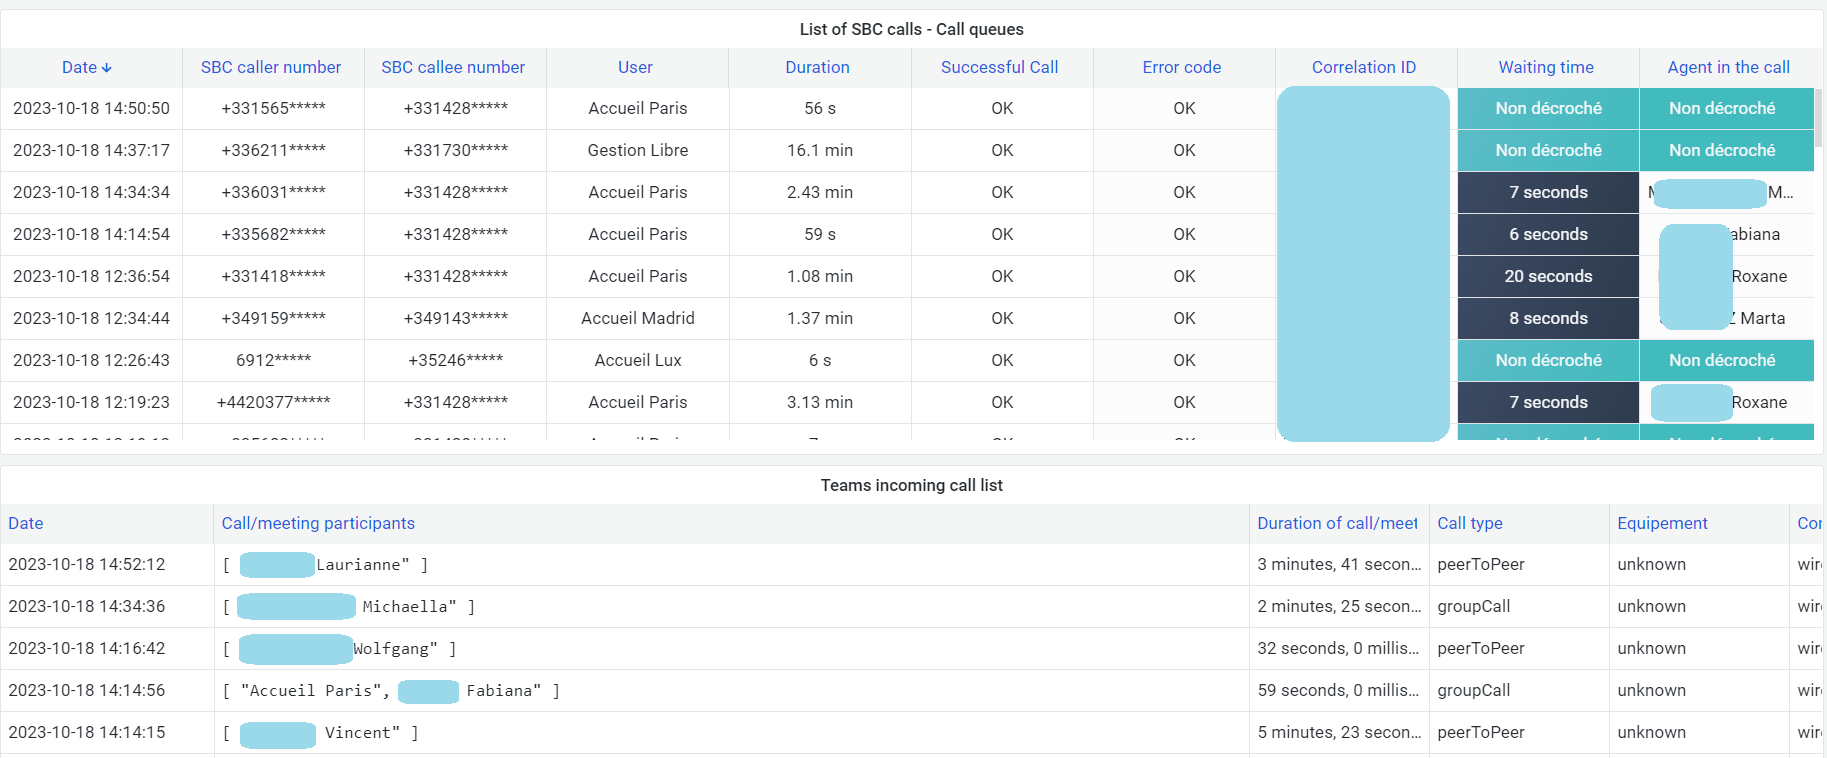
¶ Teams section - Call logs
Just like traditional charge logs, you can find details of all your calls from Teams to Teams and your SBCs, as well as your queues, in tables that can be exported in Excel format.